
Dashboard
The dashboard provides a unified, real-time overview of your organization's security posture. It consolidates metrics from attack surface, cloud security, vulnerability management, and AI assessments into a single view.
The dashboard auto-refreshes every 60 seconds and reloads when you return to the browser tab.
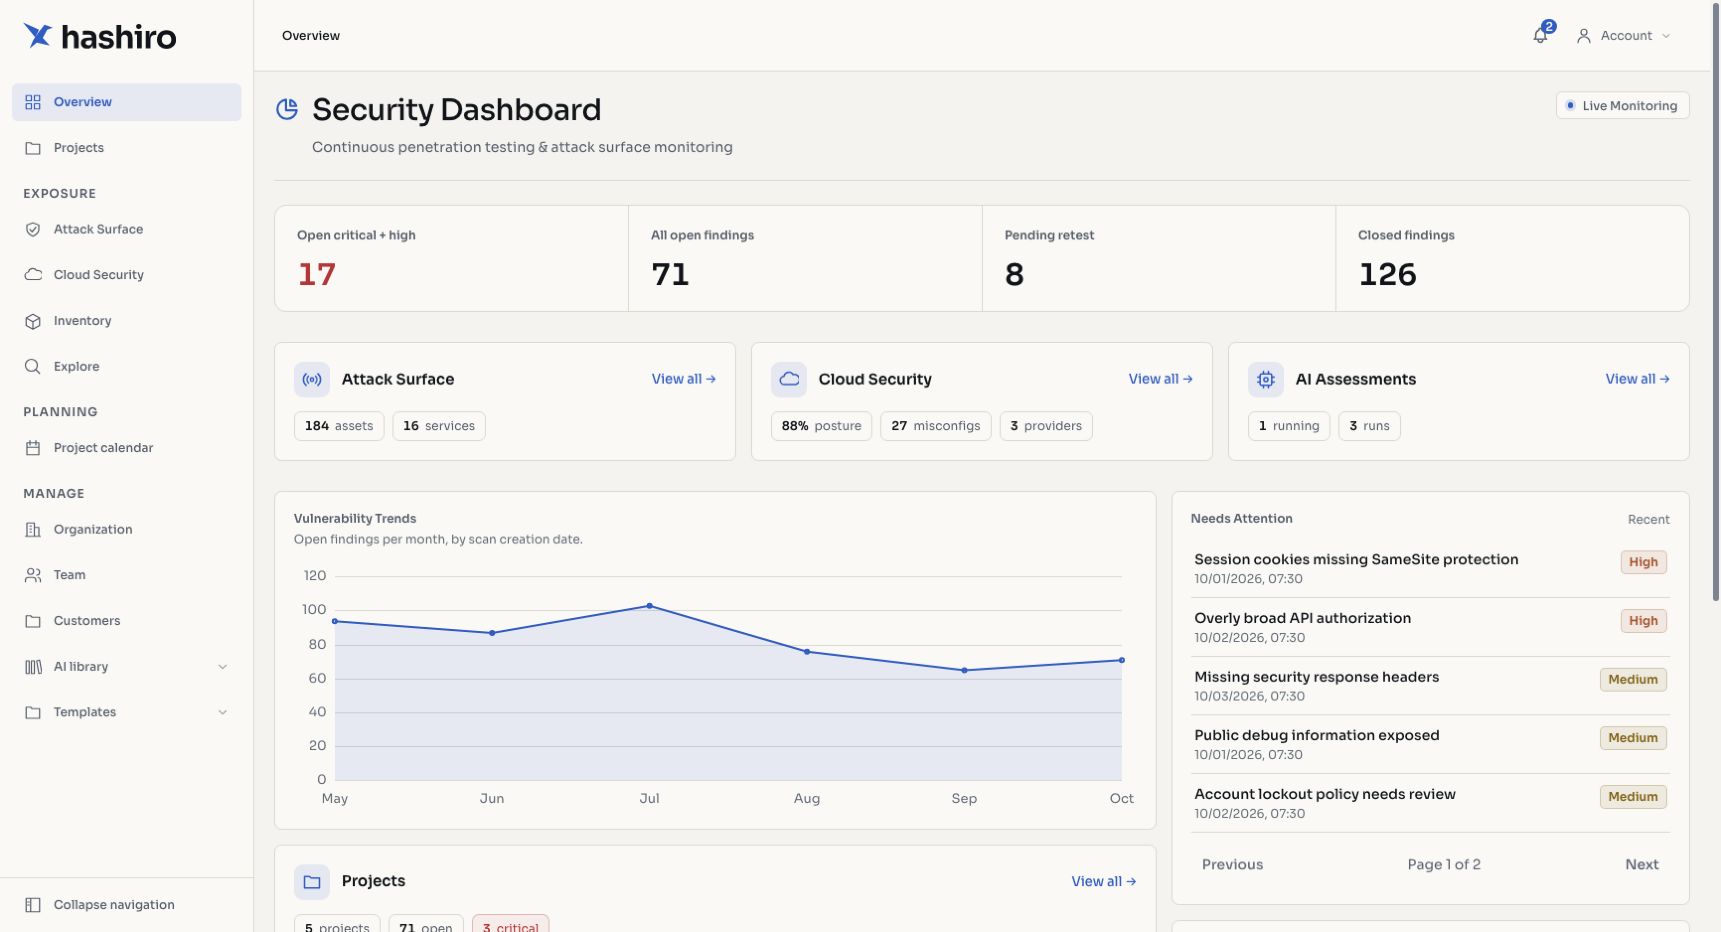
Screenshots use fictional demonstration data.
Key Performance Indicators
Four top-level KPIs give you an at-a-glance summary:
| KPI | Description |
|---|---|
| Open Severe Risks | Critical and high-severity vulnerabilities currently open across all projects |
| Open Vulnerabilities | Total count of all open findings regardless of severity |
| Pending Retest | Issues awaiting validation after a reported fix |
| Resolved Vulnerabilities | Findings confirmed as remediated |
Environment Cards
Below the KPIs, three cards summarize each major area:
Attack Surface
- Assets: total discovered assets under EASM monitoring
- Exposed Services: services visible on the internet (open ports)
- Open Risks: unresolved issues detected on the attack surface
Cloud Security
- Posture Score: aggregate score across all connected cloud accounts
- Misconfigurations: total open misconfigurations detected
- Providers: number of connected cloud accounts (AWS, Azure, GCP)
AI Agents
- Running: assessments currently in progress
- Total Runs: cumulative assessment executions
Vulnerability Trends
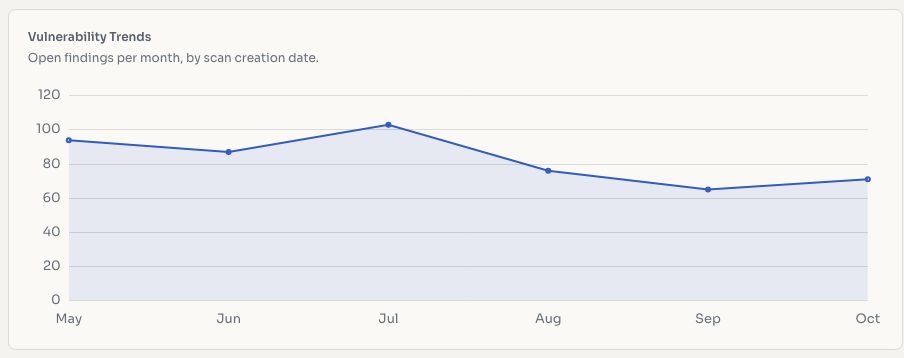
A line chart showing vulnerability counts by month, broken down by severity level. Use this to track whether your security posture is improving over time.
Top Projects
Lists your top projects ranked by vulnerability count with severity breakdown badges, making it easy to identify which engagements need the most attention.
Needs Attention
A paginated list of recently discovered vulnerabilities that require review. Highlights findings that are new or have been escalated in severity.
Open Issues by Severity
A bar chart breaking down all open issues by severity: Critical, High, Medium, Low, Informative, and Unknown.
Remediation Details
An expandable section with deeper remediation analytics:
- Effort Matrix: a priority-versus-complexity matrix that maps open vulnerabilities into quadrants, helping you prioritize by impact and effort.
- Vulnerability Age Distribution: shows how long open vulnerabilities have remained unresolved. Aging findings indicate remediation bottlenecks.
- Attack Surface Stats: summary of total assets, services, and the ratio of monitored versus unmonitored scope.
License Gating
TIP
Dashboard sections are gated by your organization's license tier. Sections for features not included in your plan show an upgrade prompt. Contact your provider or Hashiro sales for plan details.