
Attack Chains
Attack chains are visual flow diagrams that show how individual vulnerabilities combine to achieve broader impact. They connect discrete findings into end-to-end exploitation paths that demonstrate real-world risk.
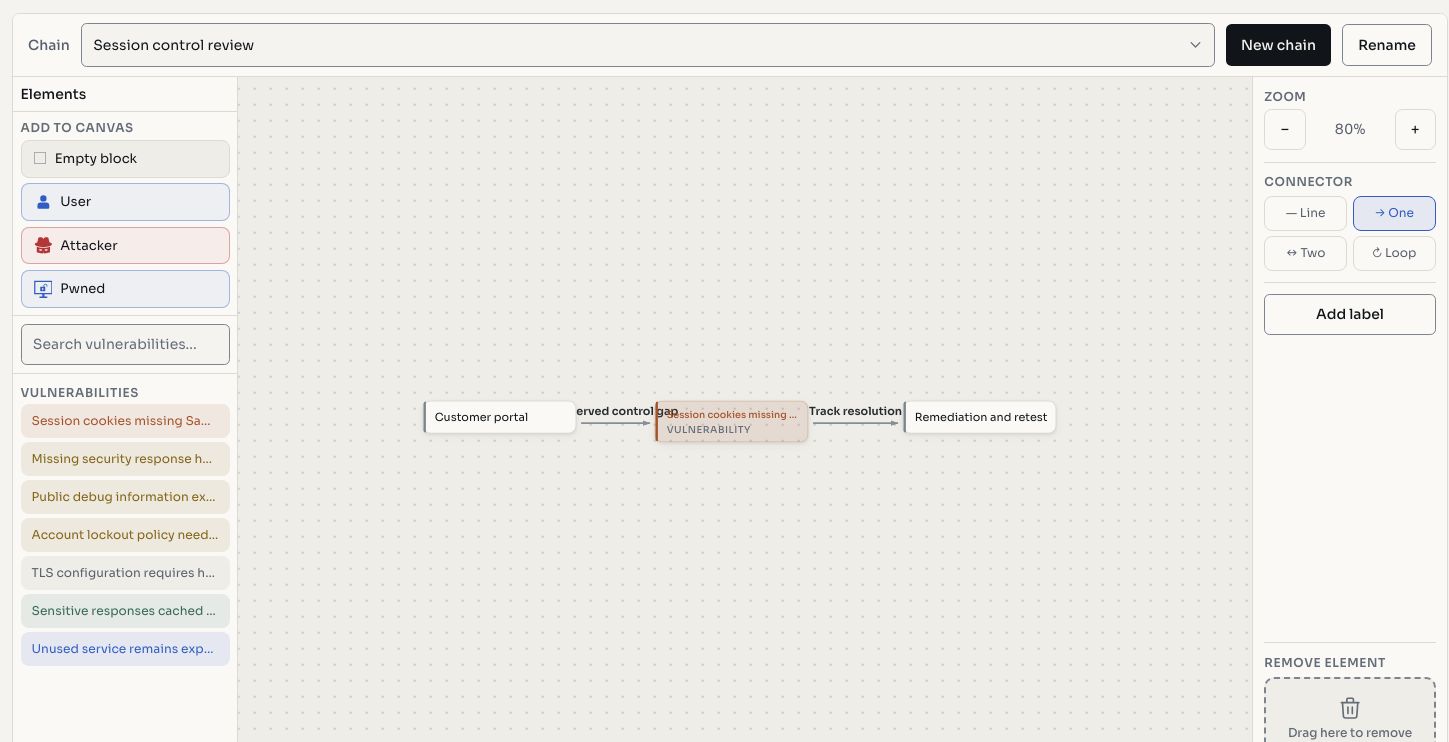
Screenshots use fictional demonstration data.
Why Attack Chains
Individual findings often don't convey the full risk picture. A medium-severity information disclosure combined with a low-severity misconfiguration might chain into a critical account takeover. Attack chains make these compound risks visible to stakeholders.
Node Types
| Node | Purpose |
|---|---|
| Vulnerability | A specific finding from the project's issues list |
| Label | A descriptive text node for annotations or phase names |
| Block | A system or component (e.g., "Web Server", "Database") |
| Person | A user role or identity (e.g., "Regular User", "Admin") |
| Attacker | The threat actor initiating the chain |
| Pwned | The compromised end state (e.g., "Full Account Takeover") |
Building Chains
Use the canvas editor to construct attack chains:
- Add nodes: place nodes on the canvas for each step in the attack
- Connect edges: draw directional edges between nodes to show the flow
- Link vulnerabilities: connect vulnerability nodes to actual findings for traceability
- Annotate: use label nodes to describe transitions between steps
You can build multiple chains per project to illustrate different attack scenarios.
Including Chains in Reports
Attack chains are embedded in generated PDF reports alongside the findings they reference. The visual diagram is included as a figure, tying individual vulnerabilities into a coherent risk story.