Inventory
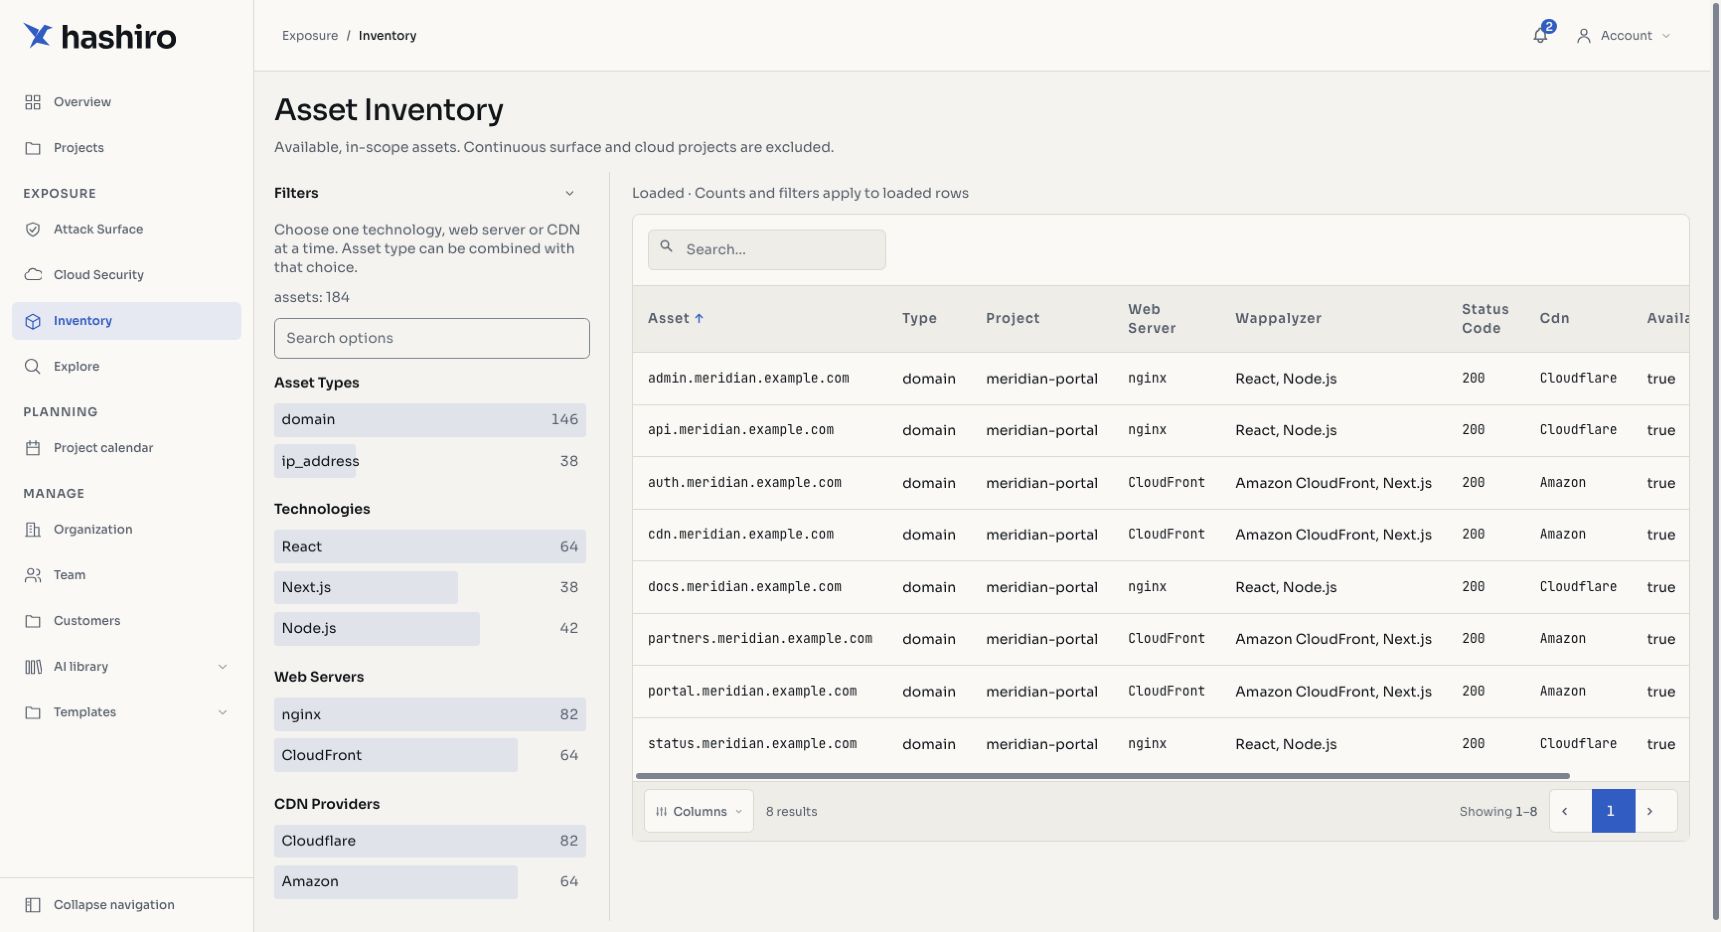
The Inventory provides a cross-project view of all discovered assets across your organization. Instead of navigating into individual projects, the inventory aggregates everything into a single, filterable interface.
Screenshots use fictional demonstration data.
Faceted Filtering
The filter sidebar lets you narrow down assets using multiple dimensions:
| Filter | Description |
|---|---|
| Type | Asset type (domain, IP, wildcard, etc.) |
| Technology | Detected technologies via Wappalyzer (e.g., React, nginx, WordPress) |
| Web Server | Underlying web server (Apache, nginx, IIS, etc.) |
| CDN Provider | Content delivery network in use (Cloudflare, Akamai, etc.) |
Each filter option shows a count bar indicating how many assets match, helping you understand the distribution of your attack surface at a glance.
Filters support in-filter search for quickly finding specific values in long lists.
Asset Table
The main view displays assets with the following columns:
| Column | Description |
|---|---|
| Asset | Hostname, IP, or identifier |
| Type | Asset classification |
| Project | Which project the asset belongs to |
| Web Server | Detected web server software |
| Technologies | Wappalyzer-detected technology stack |
| Status Code | HTTP response status from the last probe |
| CDN | CDN provider, if detected |
| Availability | Whether the asset is currently reachable |
Asset Detail
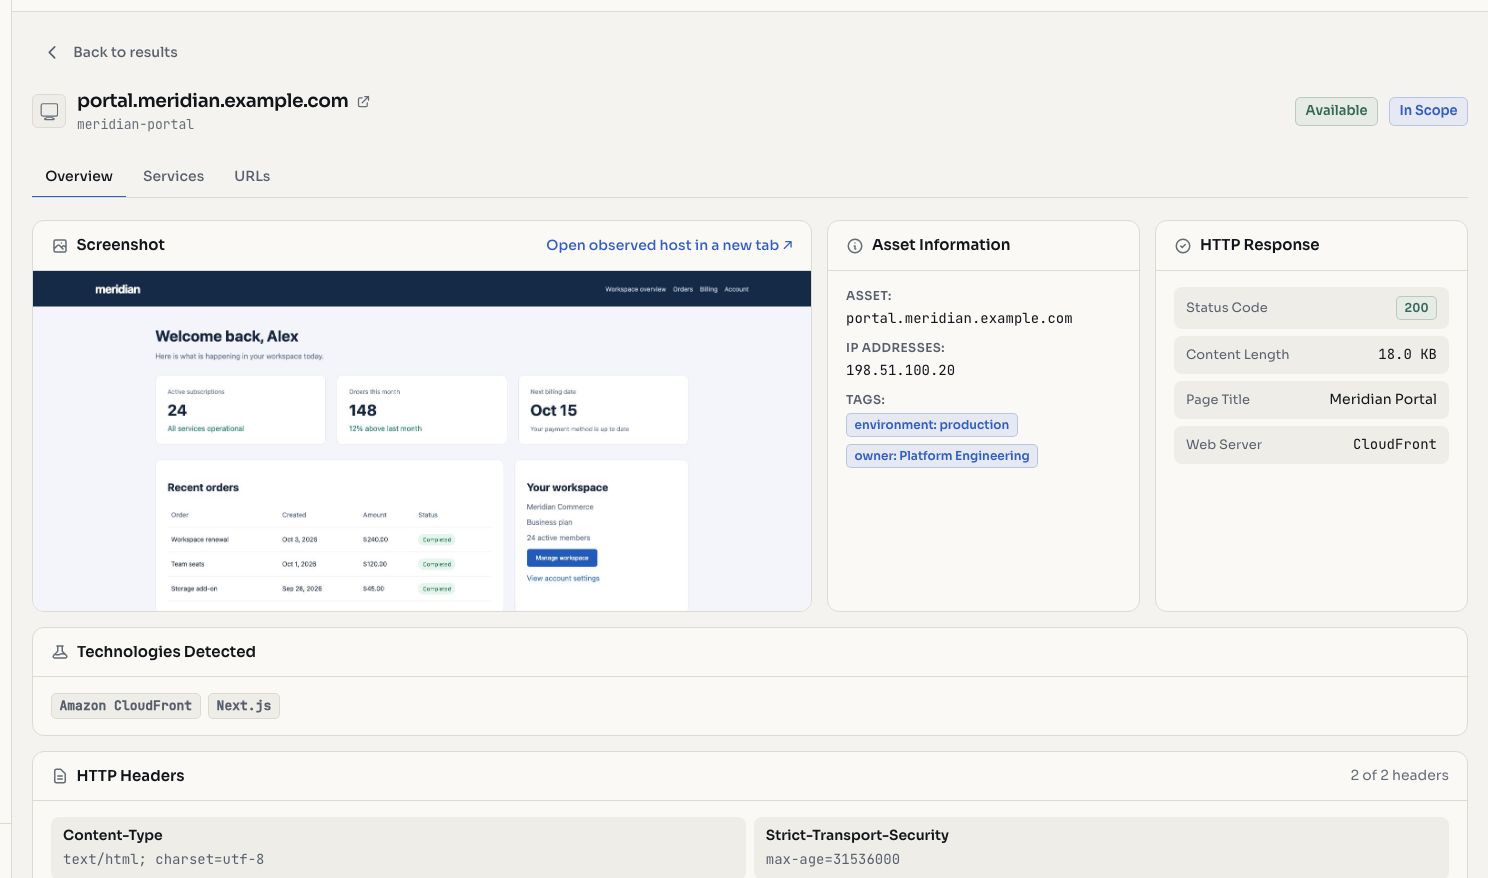
Clicking an asset opens its detail view:
- Screenshot preview from the last HTTP probe
- Full HTTP response details (headers, status, content)
- Technology detection results
- Availability and scope status
- Associated services and URL paths
- External link to the live asset